
How MIT Visualizes Supply Chain Risk [Video]
How does a company keep tabs on thousands of suppliers? That’s the question Bruce Arntzen tried to answer when he started the Hi-Viz Research Project. As Executive Director of MIT’s Supply Chain Management Program, Arntzen works with corporations to find innovative solutions to supply chain problems. The idea for the Hi-Viz project came during a 2011 meeting of the Supply Chain Risk Leadership Council. A survey of attendees listed Supply Chain Visibility as the top concern. Why? With thousands of suppliers and sub-suppliers, it can be very time-consuming to find the weakest link in a supply chain. Arntzen’s solution: an automatic visualization of the end-to-end supply chain where the weakest links could be seen in real time. Watch his interview to learn how MIT and Sourcemap developed the first automated risk visualization.
How MIT Visualizes Supply Chain Risk from Sourcemap on Vimeo.
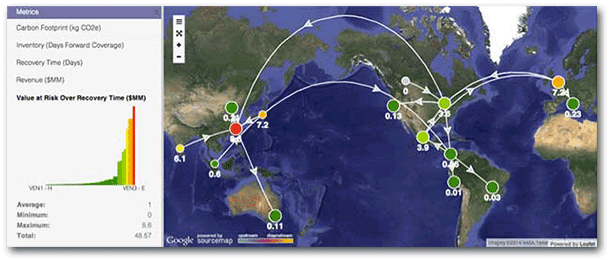
Arntzen realized that the only way to tackle the problem of supply chain visibility was to keep it simple and use existing solutions. After all, companies already have a lot of the information needed to map supply chain risk in their enterprise databases. The challenge was digging up the data across as many as ten different systems – and finding the handful of stakeholders across the organization who have access. Once the supply chain was mapped, how would a manager know which supplier or shipment represents the biggest risk? Here too, Arntzen had an off-the-shelf approach: by mapping inventory across the end-to-end supply chain, from raw materials to finished goods. When inventories run too low at a supplier, a serious disruption – a storm, strike, natural disaster – can result in an interruption that lasts days and cost millions.
The final challenge was automating supply chain visibility so that any company can do it. For this Arntzen turned to another MIT innovation: Sourcemap, the first cloud-based platform for supply chain mapping. Sourcemap began as a research project at the MIT Media Lab, down the street from his office, and is now an enterprise software startup based in NYC. For the Hi-Viz project, Sourcemap was configured for automatic visualization of enterprise data including vendors, shipments, inventory and risk. Moving to the cloud made it possible to visualize the end-to-end supply chain geographically, and for teams to work together on the data. It also had unforeseen advantages: through a real-time newsfeed, companies can receive SMS and email alerts when a serious event threatens any link in the supply chain.
In 2015, the Hi-Viz project is partnering with actuarial data providers to provide predictive risk analytics. Sourcemap is making available inventory risk mapping as part of its enterprise software-as-a-service. Want to get involved? Learn more about the Hi-Viz project, or contact Sourcemap for a demo.